
Small caps have had an incredible run since the Russell 2000 Index bottomed on March 18, 2020, returning 119% compared to the S&P 500 Index’s 60% return over the period. Will small cap outperformance continue in 2021? The early stages of this business cycle may help determine the direction for small caps as well as earnings per share, stock valuations, and technical trends.
FAVORABLE PART OF THE CYCLE
Small cap stocks historically have performed well early in economic cycles. Given that the US economy likely came out of recession late last summer or early fall of 2020, 2021 certainly qualifies as early in this cycle. The tremendous performance by small cap stocks over the past 10 months suggests that a lasting economic expansion has begun in earnest and seems to validate the historical cycle pattern of small caps beating large caps early in cycles.
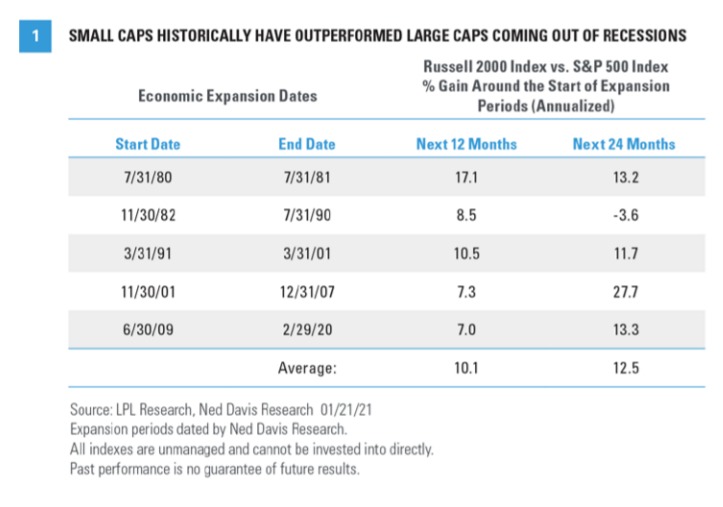
FIGURE 1 illustrates how the Russell 2000 Index historically has performed relative to the large cap S&P 500 Index during the early stages of prior economic expansions. Almost every time coming out of recession, small caps outperformed large caps over the subsequent 12 and 24 months; they outperformed by an average of 10.1% over the first year and 12.5% over the subsequent two years (on an annualized basis). We think this historical trend bodes well for small caps in 2021, though we acknowledge some excess returns probably have been pulled forward and already achieved with the recent stellar small cap run.
STRONG EARNINGS REBOUND
During recessions like the US economy suffered in 2020, smaller companies that generally tend to have weaker balance sheets and more economically sensitive revenue usually are hit harder than their large cap counterparts. That definitely played out in 2020, with FactSet’s consensus estimates calling for a substantial 51% decline in small cap earnings, based on the Russell 2000, compared with only a 15% annual decline in earnings from large cap S&P 500 companies.
The reverse tends to occur coming out of recessions, as small cap earnings typically grow much faster during the initial economic recovery phase. The numbers tell that story too, as small cap earnings in 2021 are expected to surge more than 150%, compared with a still respectable 23% for S&P 500 earnings, which pales in comparison. Remarkably, consensus earnings estimates for 2021 of $166.25 per share for the Russell 2000 are 23% above pre-pandemic 2019 levels. For the S&P 500, 2021 estimates are currently only 4% above 2019 levels.
Small cap earnings also enjoy more momentum right now, with estimates having risen sharply since the start of the fourth quarter of 2020. Russell 2000 earnings estimates for 2021 have been raised by 12% since October 1, 2020, compared to just 2% for the S&P 500.
Expectations of this sharp earnings rebound have helped drive strong small cap performance since the bull market began in March 2020. Small cap stocks are broadly more economically sensitive than large cap stocks, which is helpful when economic growth expectations improve. This helps explain why optimism surrounding the reopening of the economy and prospects for more fiscal stimulus under the new administration have given small caps such a big boost lately.
We think a higher US corporate tax rate—which we expect in 2022—is a key risk to earnings next year and would likely hurt small cap earnings more than their large cap counterparts because small cap companies tend to be more domestically focused.
All earnings data and consensus estimates are sourced from FactSet
PRICING IN GOOD NEWS
Small cap stocks are trading at a substantial premium valuation to large caps—about 40% based on next 12 months’ price-to-earnings multiples. When looking out to 2022—when earnings will be closer to their full potential—valuations don’t look quite as rich, with the small cap PE about 27% above that of large caps. The strong small cap earnings growth outlook probably deserves a premium valuation at this point. Over the past 10 years, small caps have traded at a 37% higher forward PE than large caps.
However, with the Russell 2000 having more than doubled since the March 2020 lows, we think it makes sense to be a bit cautious with small cap stocks in the near term. They are pricing in an optimistic recovery scenario when the ongoing threat of COVID-19 could delay the full reopening of the US economy a little longer.
Also consider that a weaker US dollar—which we expect in 2021—tends to help large cap multinationals more than smaller companies due to their higher international revenue exposure, which may limit the ability of small caps stocks to outperform.
POST-ELECTION SURGE
With much of the focus in 2020 on the performance of large cap growth and the “stay at home” trade, some investors may have overlooked the fact that the Russell 2000 actually outperformed the S&P 500 for the year, albeit slightly. Small caps were down year-to-date heading into the presidential election in November, but the policy clarity and prospects for more fiscal stimulus sparked a year-end rally of more than 22%, and pushed the Russell 2000 to its first all-time high since August 2018 [FIGURE 2].
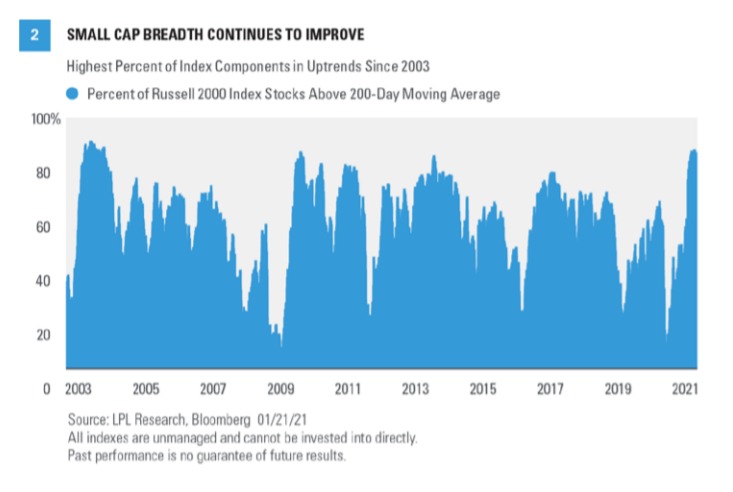
Performance has not be limited to the index level, either. Breadth continues to improve for small caps. (Breadth is the percentage of stocks in the category participating in the market.) The percent of index constituents trading above their 200-day moving average has surged to over 89%, the highest level since 2004. Not only is strong breadth a hallmark of a healthy market, but the levels of participation we are seeing now tend to be found almost exclusively at the beginning of bull markets, not the end.
The election outcome, stimulus prospects, and progress toward fully reopening the economy as COVID-19 vaccines are distributed have triggered a leadership change from large caps to small caps. However, it has not triggered the sort of style rotation we have seen within the large cap space. Even as large cap value has outperformed large cap growth by more than 5 percentage points over the past three months, small cap growth and small cap value performance have been equally stellar, with both the Russell 2000 Growth and Russell 2000 Value indexes returning 34%.
LPL RESEARCH’S VIEW
At this point we are comfortable maintaining our neutral small cap view—but with a positive bias. We are in a favorable part of the economic cycle, the earnings outlook is quite strong, and small caps are enjoying strong breadth within the universe with most stocks exhibiting positive momentum. But much of the good news may be priced in already, introducing the potential for disappointment if COVID-19 delays the full reopening of the economy. Also, currency and tax headwinds may be on the horizon.
Thank you to LPL Research Senior Analyst Scott Brown, CMT for contributing to this commentary.
Click here to download a PDF of this report.
IMPORTANT DISCLOSURES
This material is for general information only and is not intended to provide specific advice or recommendations for any individual. There is no assurance that the views or strategies discussed are suitable for all investors or will yield positive outcomes. Investing involves risks including possible loss of principal. Any economic forecasts set forth may not develop as predicted and are subject to change.
References to markets, asset classes, and sectors are generally regarding the corresponding market index. Indexes are unmanaged statistical composites and cannot be invested into directly. Index performance is not indicative of the performance of any investment and do not reflect fees, expenses, or sales charges. All performance referenced is historical and is no guarantee of future results.
Any company names noted herein are for educational purposes only and not an indication of trading intent or a solicitation of their products or services. LPL Financial doesn’t provide research on individual equities.
All information is believed to be from reliable sources; however, LPL Financial makes no representation as to its completeness or accuracy.
US Treasuries may be considered “safe haven” investments but do carry some degree of risk including interest rate, credit, and market risk. Bonds are subject to market and interest rate risk if sold prior to maturity. Bond values will decline as interest rates rise and bonds are subject to availability and change in price.
The Standard & Poor’s 500 Index (S&P500) is a capitalization-weighted index of 500 stocks designed to measure performance of the broad domestic economy through changes in the aggregate market value of 500 stocks representing all major industries.
The PE ratio (price-to-earnings ratio) is a measure of the price paid for a share relative to the annual net income or profit earned by the firm per share. It is a financial ratio used for valuation: a higher PE ratio means that investors are paying more for each unit of net income, so the stock is more expensive compared to one with lower PE ratio.
Earnings per share (EPS) is the portion of a company’s profit allocated to each outstanding share of common stock. EPS serves as an indicator of a company’s profitability. Earnings per share is generally considered to be the single most important variable in determining a share’s price. It is also a major component used to calculate the price-to-earnings valuation ratio.
All index data from FactSet.
Please read the full Outlook 2021: Powering Forward for additional description and disclosure.
This research material has been prepared by LPL Financial LLC.
Securities and advisory services offered through LPL Financial (LPL), a registered investment advisor and broker-dealer (member FINRA/SIPC). Insurance products are offered through LPL or its licensed affiliates. To the extent you are receiving investment advice from a separately registered independent investment advisor that is not an LPL affiliate, please note LPL makes no representation with respect to such entity.
Not Insured by FDIC/NCUA or Any Other Government Agency | Not Bank/Credit Union Guaranteed | Not Bank/Credit Union Deposits or Obligations | May Lose Value
Tracking # 1-05102970 (Exp. 01/22)