
The economic recovery continues, as the recipe of vaccines, the reopening, and record stimulus all have combined to produce what should be one of the best years for growth ever. Although some economic indicators could be peaking or about to peak, the stage is set for this cycle of growth to continue for many years, which may surprise some investors. We discuss why inflation might be in the headlines, but still shouldn’t be a major worry for investors.
This Economic Cycle is Quite Young
The U.S. economic recovery is now in full swing. Despite the natural challenges of ramping back up, the recovery still seems capable of providing upside surprises. As a result of strides toward full reopening, rapid vaccine distribution, massive stimulus efforts, and support from the Fed, we recently upgraded our 2021 forecast for U.S. gross domestic product (GDP) growth to 6.25%-6.75%. Toss in a record number of earnings beats, resulting in S&P 500 Index first-quarter earnings growth of nearly 50% (FactSet), which is more than double the expectations at the start of the quarter, and it is clear the economy is humming right along. Last year’s 3.5% drop in GDP, the worst year since the Great Depression, is a thing of the past.
Technically, the U.S. may still be in a recession, as the National Bureau of Economic Research (NBER) hasn’t called the end yet. But considering we’ve seen various levels of output match or exceed pre-pandemic levels, it’s clear we aren’t in a recession anymore, as it likely ended last summer. Retail sales, for instance, were making new highs by June 2020 and have soared higher over the past year. NBER isn’t about being first, they are about being right, and it isn’t abnormal for them to call the end of a recession a year or more after it officially ended. We’ve found that ISM manufacturing and services data tend to peak about a year after a recession ends, and both appear to have peaked in the spring—another clue the recession ended sometime last summer.
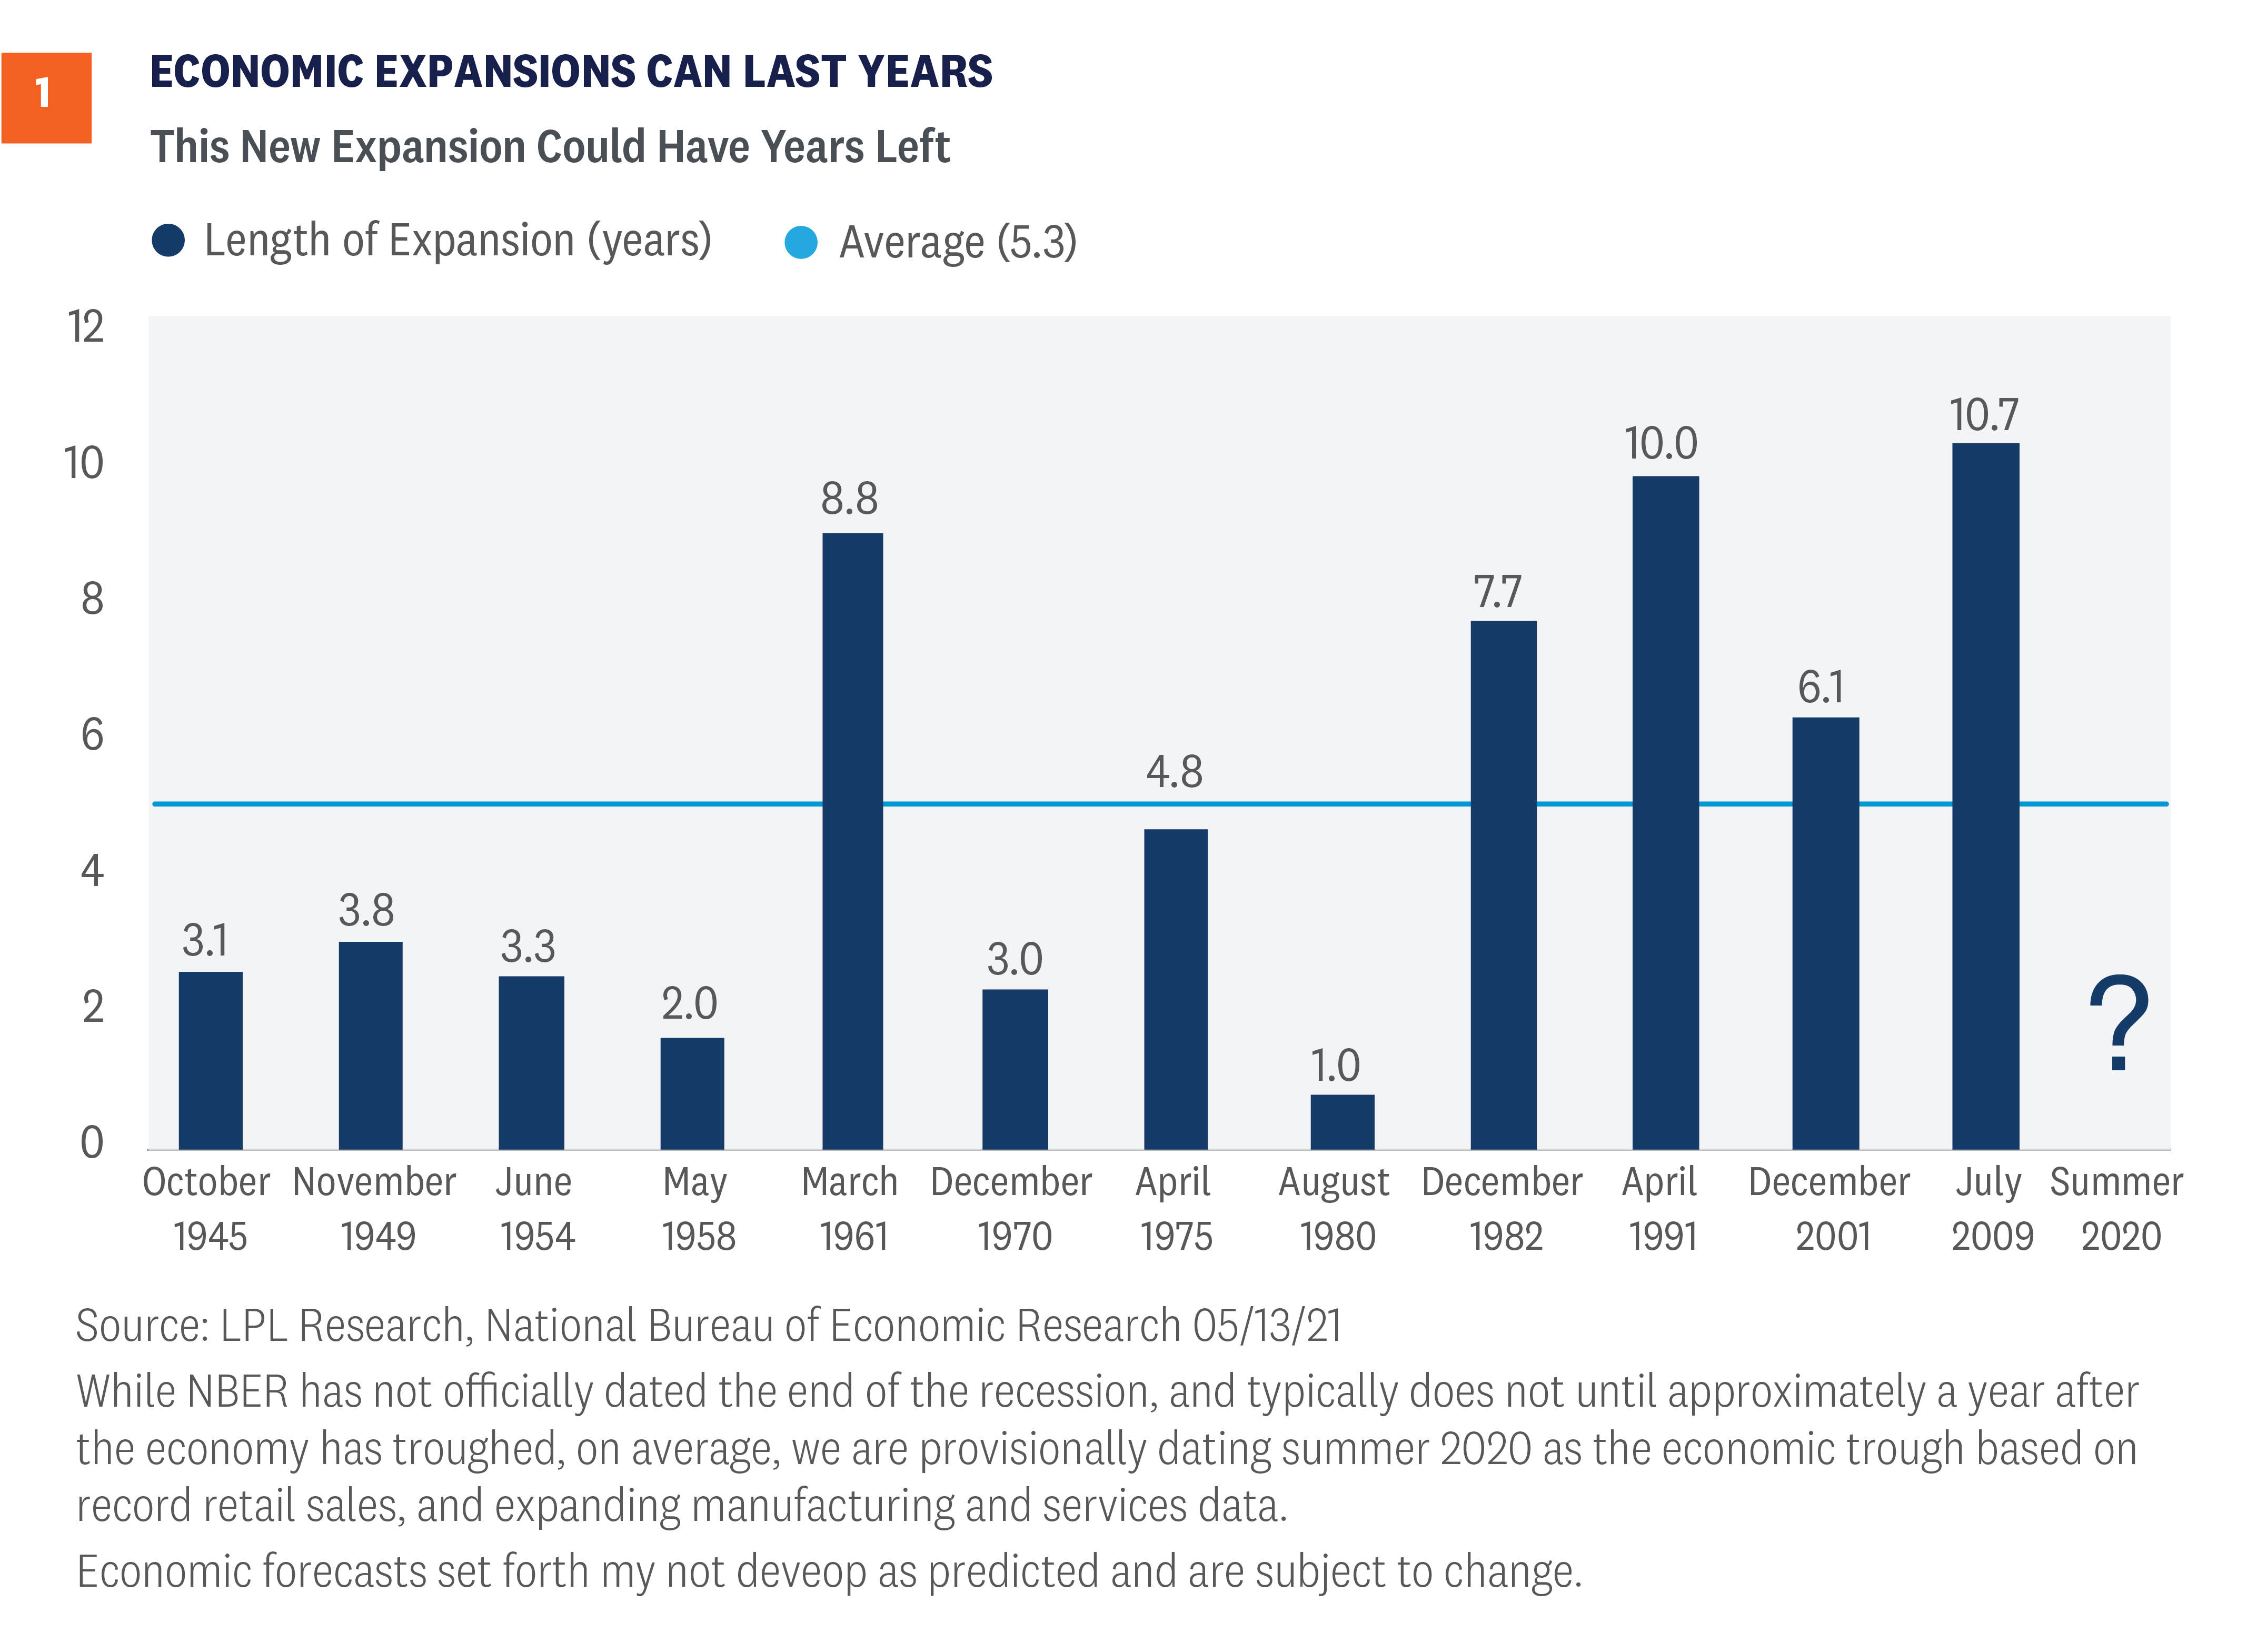
Just because economic data is peaking doesn’t mean the new expansion is over. In fact, it’s perfectly normal to see the year-over-year levels of growth peak about a year after a recession ends, and be followed by many more years of growth. As shown in [Figure 1], the average expansion has lasted more than five years, with the last four cycles all lasting longer. The last expansion was the longest ever, making it to 11 years old before COVID-19 struck, and otherwise might have gone on even longer. However, this cycle may not last as long as the last one, as this wasn’t your average recession. Because the recession last year was likely the shortest ever (besting the six-month recession in the early 1980s) and the economy was supported by historic stimulus, some imbalances weren’t worked off like we tend to see in a normal recession. Corporate debt levels remain high, supported by low interest rates, and stock valuations never really reset. The good news is this new cycle of growth has enough going for it to be at least average, and even that would mean it still has another four years of economic growth left. There’s nothing wrong with being average!
Let’s Talk About Inflation
The U.S. Bureau of Labor Statistics released its monthly report on inflation on Wednesday, May 12, revealing that the headline Consumer Price Index (CPI) rose 0.8% month over month and 4.2% year over year, well above expectations. Core CPI, which strips out volatile food and energy, rose 0.9% month over month, its highest reading since the early 1980s, and 3.0% year over year, again well above what economists thought. As a result, stocks had one of their worst days in months over fears higher inflation could mean the Fed will be forced to hike rates sooner.
The market took notice, pushing the market-implied five-year breakeven inflation rate—the difference between five-year Treasury and five-year TIPS yields—up to a 13-year high. When there is a wide spread, market participants are expecting higher inflation. Meanwhile, various industrial metals, which are linked to higher inflation, are trading at 52-week—or even all-time highs. Copper, for instance, made a new all-time high last week and is also signaling higher inflation ahead.
Here are some reasons we expect inflation to be transitory:
- The root cause. The reopening is happening, supply chain issues are making it harder to get goods, some jobs are hard to fill, and massive stimulus has created high savings levels, all of which have caused price pressures to build. But once the reopening has taken place and these bottlenecks have cleared, we would expect inflation readings to come back down. The Fed agrees, having said for months that any higher inflation numbers will be transitory, which means things should go back to normal once we get past the shock of reopening.
- Easy comparisons. In the midst of the pandemic last spring, CPI was negative three consecutive months in a row and April saw one of the largest drops ever. Now with the economy improving, comparisons from those dark days are extremely easy, likely distorting the yearly inflation numbers.
- Recovery plays accounted for most of the jump. Used car and truck prices jumped a record 10%, lodging climbed 7.6%, airfare 10.2%, car rentals 16.2%, and sporting events 10.1%. All of these are heavily impacted by the reopening process and accounted for nearly all of the jump. As these prices get back to normal, we expect inflation to calm down. How many more cars can people buy? And, of course sporting events were cheaper a year ago when no one was going to them. Meanwhile, other major components of CPI, like rents (0.2%), showed much more modest increases.
- Bigger forces still in play. Yes, near-term inflation has spiked, but in the longer-term a 1970s-style scare is extremely unlikely. Technology, globalization, the Amazon effect, increased productivity and efficiency, automation, and high debt (which puts downward pressure on inflation) are among the major structural forces that have put a lid on inflation the past decade plus—and will likely continue to do so.
Conclusion
The economy continues to strengthen and, so far, this year is off to a better start than even the most bullish economist could have expected. There are always risks though, including COVID-19 spread outside the U.S., deficit spending, geopolitics, inflation, tax increases, and a potential policy mistake. Not to mention after a record 89% rally for the S&P 500, a well-deserved break or consolidation during a historically weak time seasonally would be perfectly normal.
But, amid a backdrop of an improving economy, massive levels of fiscal and monetary stimulus, and rising vaccination rates, we don’t expect any pullbacks to last very long, and we’d use any that appear as a buying opportunity. We upgraded our forecast for the global economy and U.S. corporate earnings in April, and last week upgraded our 2021 year-end S&P 500 fair-value target range to 4,400-4,450. We continue to recommend an overweight to equities and underweight to fixed-income position relative to investors’ targets, as appropriate.
Read previous editions of Weekly Market Commentary on lpl.com at News & Media.
This material is for general information only and is not intended to provide specific advice or recommendations for any individual. There is no assurance that the views or strategies discussed are suitable for all investors or will yield positive outcomes. Investing involves risks including possible loss of principal. Any economic forecasts set forth may not develop as predicted and are subject to change.
References to markets, asset classes, and sectors are generally regarding the corresponding market index. Indexes are unmanaged statistical composites and cannot be invested into directly. Index performance is not indicative of the performance of any investment and do not reflect fees, expenses, or sales charges. All performance referenced is historical and is no guarantee of future results.
Any company names noted herein are for educational purposes only and not an indication of trading intent or a solicitation of their products or services. LPL Financial doesn’t provide research on individual equities.
All information is believed to be from reliable sources; however, LPL Financial makes no representation as to its completeness or accuracy.
US Treasuries may be considered “safe haven” investments but do carry some degree of risk including interest rate, credit, and market risk. Bonds are subject to market and interest rate risk if sold prior to maturity. Bond values will decline as interest rates rise and bonds are subject to availability and change in price.
The Standard & Poor’s 500 Index (S&P500) is a capitalization-weighted index of 500 stocks designed to measure performance of the broad domestic economy through changes in the aggregate market value of 500 stocks representing all major industries.
The PE ratio (price-to-earnings ratio) is a measure of the price paid for a share relative to the annual net income or profit earned by the firm per share. It is a financial ratio used for valuation: a higher PE ratio means that investors are paying more for each unit of net income, so the stock is more expensive compared to one with lower PE ratio.
Earnings per share (EPS) is the portion of a company’s profit allocated to each outstanding share of common stock. EPS serves as an indicator of a company’s profitability. Earnings per share is generally considered to be the single most important variable in determining a share’s price. It is also a major component used to calculate the price-to-earnings valuation ratio.
All index data from FactSet.
Please read the full Outlook 2021: Powering Forward publication for additional description and disclosure.
This research material has been prepared by LPL Financial LLC.
Securities and advisory services offered through LPL Financial (LPL), a registered investment advisor and broker-dealer (member FINRA/SIPC). Insurance products are offered through LPL or its licensed affiliates. To the extent you are receiving investment advice from a separately registered independent investment advisor that is not an LPL affiliate, please note LPL makes no representation with respect to such entity.
| Not Insured by FDIC/NCUA or Any Other Government Agency | Not Bank/Credit Union Guaranteed | Not Bank/Credit Union Deposits or Obligations | May Lose Value |
RES-749550-0521 | For Public Use | Tracking # 1-05144622 (Exp. 05/22)